In this article, Aviva Investors’ research team crunches the data to see how evolving macro conditions are reflected in private debt returns. A key finding is that illiquidity premia across different sectors in private debt do not travel uniformly and have their own idiosyncratic dynamics through market cycles. For this reason, investors may benefit from a multi-asset approach to private debt.
“It is a capital mistake to theorise before one has data. Insensibly one begins to twist facts to suit theories, instead of theories to suit facts...” So said master detective Sherlock Holmes in Arthur Conan Doyle’s story “A Scandal in Bohemia”.
We on the Aviva Investors real assets research team agree with the sentiment. Accurate and timely data is a vital starting point for investment decision making. As a large lender in private markets, Aviva Investors has access to a pool of proprietary data that we can use to analyse market trends and inform our approach.
In private debt markets, illiquidity premia are a key factor in assessing relative value between private sectors as well as versus public debt markets. For investors who can provide long-term patient capital, these premia represent the potential to harvest additional returns from investing in private debt, whilst also enabling investors with a multi-asset or opportunistic approach to take advantage of relative-value opportunities between private debt sectors and pricing dislocations versus public markets.
Our dataset encompasses over 2,000 transactions over a 25-year period. It covers sterling and euro investment-grade (IG) deals only, covering primarily internal transactions but also external transactions where we were able to obtain pricing data.
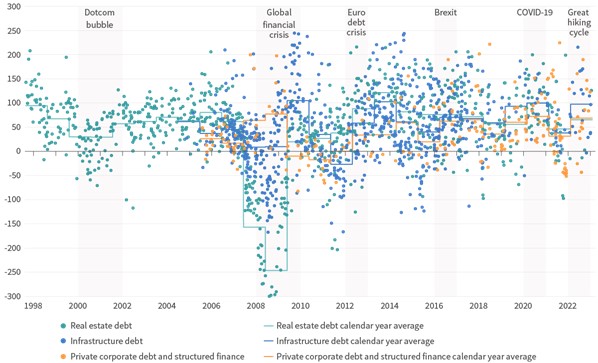
The illiquidity premia output captures the spread premium over the most relevant reference public debt index (ICE BofAML index data) at the point of transaction, represented as dots in Figure 1. The illiquidity premium represents an additional spread (which is not always positive) over public debt markets to compensate for increased illiquidity and/or complexity risk. The chart also includes the discrete calendar-year average illiquidity premium which equally weights the underlying transaction data.
Figure 1 shows that over 2023 illiquidity premia improved across all private debt sectors. Supporting factors in this trend included the expectation that developed market central banks were approaching the end of their interest-rate hiking cycles and growing optimism surrounding the likelihood of a “soft landing” outcome, which has moderated spreads on comparable public debt.
Figure 1: Illiquidity premia in private debt to December 2023 (basis points)

Past performance is not a reliable indicator of future returns.
Note: For illustrative purposes only. The value of an investment can go down as well as up and there is no guarantee that the forecasted return will be achieved.
Source: Aviva Investors, ICE BofAML index. Data as of December 31, 2023.
We also note that real estate debt illiquidity premia improved towards the end of 2023, in line with expectations that underlying real-estate valuations were showing signs of bottoming out, especially for thematically resilient sectors such as living and industrials.
The key takeaways we draw from this data are (1), illiquidity premia are not static and vary through the market cycle; and (2), illiquidity premia across the various private debt sectors do not travel uniformly and have various dynamics through market cycles.
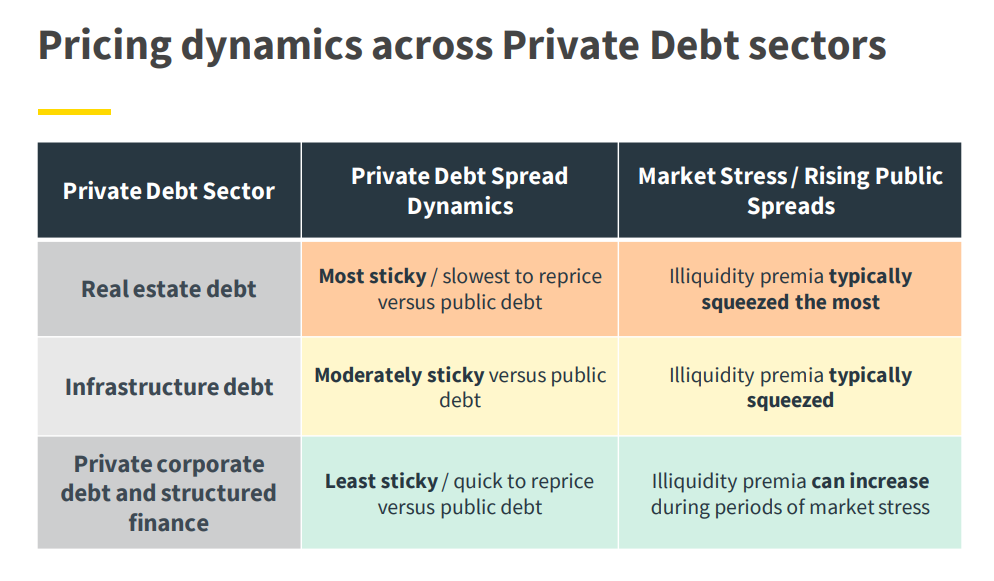
An important driver of the varying pricing dynamics across private debt sectors is the “stickiness” of private debt sector spreads versus public debt.
- Real estate debt spreads tend to be the most “sticky”, resulting in illiquidity premia that have historically been correlated to the real estate cycle. Real estate debt illiquidity premia tend to compress when real estate capital values decline, and then typically recover as real estate valuations rise.
- Private corporate debt spreads tend to be the least sticky and re-price the fastest to public debt markets. Given this dynamic, illiquidity premia tend to remain in a narrower range over the long term. Also, some of the highest illiquidity premia have occurred during periods of higher market volatility, especially when there is reduced availability of capital from more traditional lending sources.
- Infrastructure debt spreads tend to be moderately sticky, and re-price more gradually to public debt markets.
As a result of these factors, private debt sectors have various pricing dynamics over economic cycles, as outlined further in Figure 2. Therefore, when investing in private debt a multi-asset approach can be beneficial and allow investors to take advantage of such relative value pricing opportunities between sectors.
Figure 2: Pricing dynamics across private debt sectors

Past performance is not a reliable indicator of future returns.
Source: Aviva Investors and ICE BofAML index data up to December 31, 2023. For illustrative purposes only.
Looking forward, we believe private debt sectors should continue to generate attractive illiquidity premia in the coming months, given the restrictive lending environment from more traditional sources of capital. Across private debt sectors, we are typically seeing more attractive illiquidity premia for euro private debt sectors, with, however, higher “all-in” yields for sterling private debt sectors, given the differential in sterling and euro “risk-free” rates.
For real estate debt, we believe illiquidity premia in sectors such as living and industrials should continue to show resilience in 2024. We continue to exercise caution regarding non-prime assets, particularly in the office sector.
A key risk to illiquidity premia in the short term would be worse-than-expected GDP growth or an unexpected spike in inflation. In this scenario, it is likely credit risk would sharply reprice, with private debt spreads typically lagging public markets.
Note: The illiquidity premia are calculated based on Aviva Investors proprietary deal information. There are various methodologies that can be employed to calculate the illiquidity premium. Please note that illiquidity premia shown are measured against broad relevant public debt reference index data, are rating band (not notch) matched and are not duration/maturity matched.
Important information
This is a marketing communication.
Except where stated as otherwise, the source of all information is Aviva Investors Global Services Limited (AIGSL). Unless stated otherwise any views and opinions are those of Aviva Investors. They should not be viewed as indicating any guarantee of return from an investment managed by Aviva Investors nor as advice of any nature. Information contained herein has been obtained from sources believed to be reliable, but has not been independently verified by Aviva Investors and is not guaranteed to be accurate. Past performance is not a guide to the future. The value of an investment and any income from it may go down as well as up and the investor may not get back the original amount invested. Nothing in this material, including any references to specific securities, assets classes and financial markets is intended to or should be construed as advice or recommendations of any nature. Some data shown are hypothetical or projected and may not come to pass as stated due to changes in market conditions and are not guarantees of future outcomes. This material is not a recommendation to sell or purchase any investment.
In the UK, this document is by Aviva Investors Global Services Limited. Registered in England No. 1151805. Registered Office: 80 Fenchurch Street, London, EC3M 4AE. Authorised and regulated by the Financial Conduct Authority. Firm Reference No. 119178.
572900 10/04/2025


